Codex Telemetry Shows the Agent Is a Runtime, Not a Chat Window
Most people evaluate coding agents by reading the final answer.
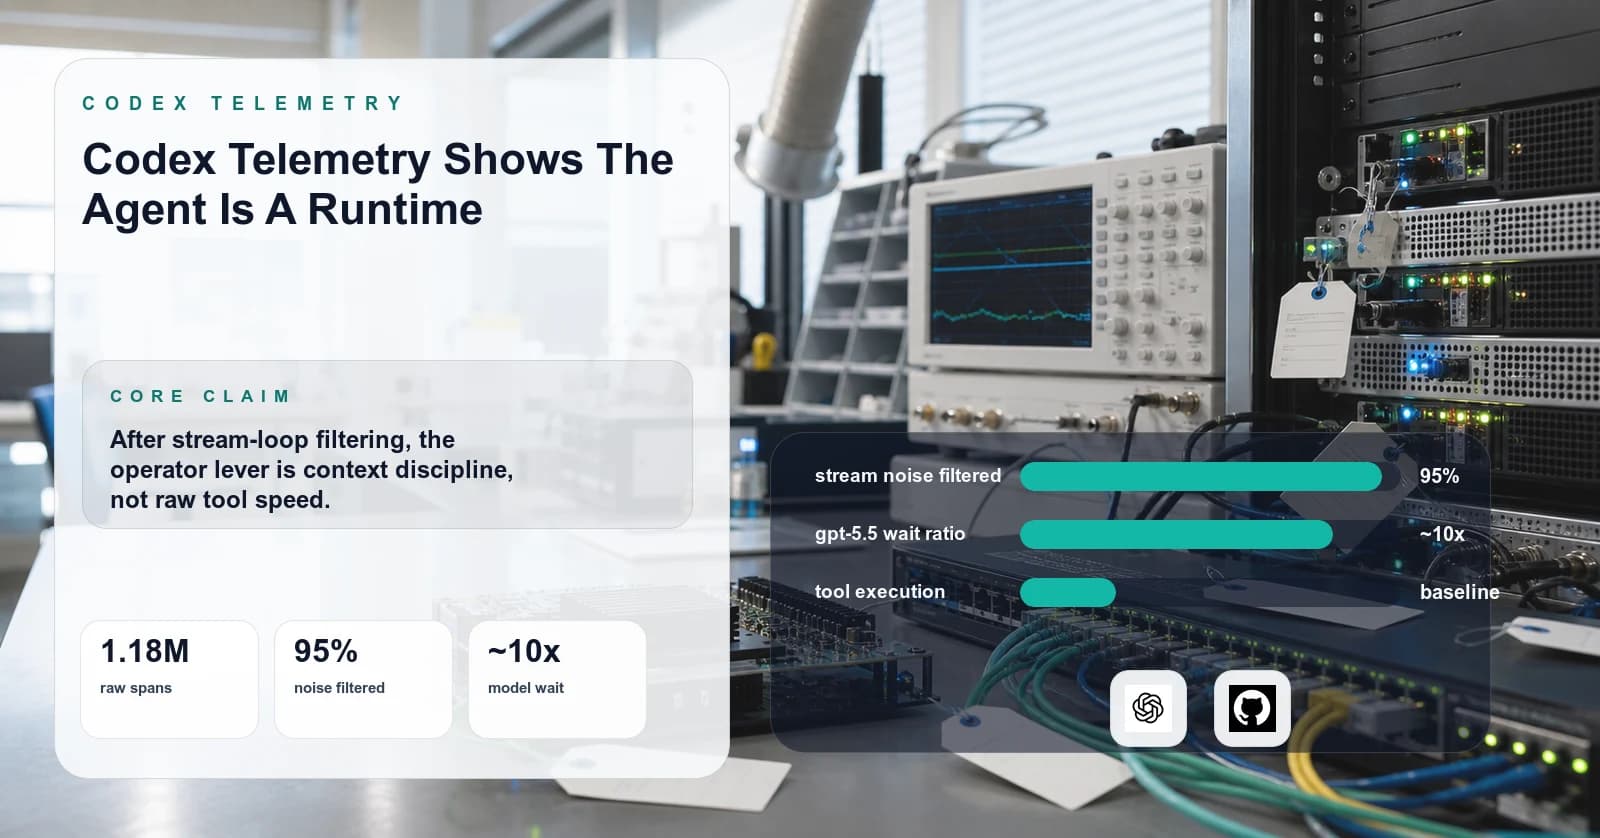
That misses the system. And once you actually look at the system, the contrarian finding is not the runtime metaphor itself. It is what dominates the runtime: each model sampling request takes ~80x longer than each tool call at p50.
For Codex, the useful evidence is not the raw span count. It is the runtime trace after the stream-loop noise is separated from the operational signal, and inside that operational surface, one ratio overrides the others.
I rebuilt the Codex analysis from a sanitized OpenTelemetry overlay:
| Layer | Raw count | Noise removed | Operational count |
|---|---|---|---|
| Logs | 731,341 | 689,369 response-delta logs | 41,972 |
| Spans | 1,180,462 | 1,118,589 stream receive-loop spans | 61,873 |
The raw telemetry still matters for coverage. It covered 24,827 telemetry files from March 6, 2026 through May 7, 2026. But raw spans should not be used as a proxy for conversation volume.
The better denominators are:
| Denominator | Count |
|---|---|
| Hashed telemetry conversations | 171 |
| User prompt log records | 279 |
| Span turn IDs | 266 |
| Tool result log records | 2,998 |
| Span call IDs | 2,994 |
Sensitive values were suppressed or hashed in the mart: user emails, account IDs, prompts, tool arguments, tool outputs, and cwd values.
The Finding
The first finding is a correction: most of the raw event volume was not agent work.
| Raw surface | Noise class | Share |
|---|---|---|
| Response delta logs | 689,369 of 731,341 logs | 94.26% |
receiving and handle_responses spans | 1,118,589 of 1,180,462 spans | 94.76% |
After filtering the receive-loop spans, the operational span categories look like this:
| Category | Spans | p50 | p95 |
|---|---|---|---|
| Tool dispatch | 23,904 | 11.62 ms | 1,159.15 ms |
| App-server / RPC | 15,935 | 0.31 ms | 295.89 ms |
| Model stream request | 11,163 | 3,601.86 ms | 42,407.97 ms |
| Other operational | 9,078 | 5.77 ms | 62,234.71 ms |
| Config/auth/capability | 1,279 | 0.06 ms | 426.62 ms |
| Turn orchestration | 514 | 104,758.77 ms | 600,014.78 ms |
The "Other operational" bucket is heterogeneous (catch-all for spans not in the named categories), so its p95 should not be read as a single-surface latency claim. The named categories above and below are the cleaner signal.
Top operational spans:
| Span | Count | p50 | p95 |
|---|---|---|---|
build_tool_call | 6,325 | 0.01 ms | 13.08 ms |
handle_output_item_done | 6,321 | 0.20 ms | 13.39 ms |
list_all_tools | 5,269 | 4.75 ms | 15.56 ms |
handle_tool_call | 2,994 | 118.88 ms | 3,896.55 ms |
dispatch_tool_call_with_code_mode_result | 2,681 | 72.00 ms | 3,068.46 ms |
exec_command | 2,589 | 93.96 ms | 1,163.55 ms |
responses_websocket.stream_request | 1,613 | 7,428.90 ms | 60,792.09 ms |
run_sampling_request | 1,553 | 9,645.65 ms | 91,059.24 ms |
That is the runtime surface: tool construction, output handling, app-server requests, model streaming, turn orchestration, and command execution.
The Headline Finding
Once the receive-loop noise is filtered, one per-call ratio dominates everything else:
| Per-call surface | p50 | p95 |
|---|---|---|
run_sampling_request (model wait) | 9,645.65 ms | 91,059.24 ms |
handle_tool_call (tool execution) | 118.88 ms | 3,896.55 ms |
exec_command (shell execution) | 93.96 ms | 1,163.55 ms |
Each model sampling request takes ~81x longer than each tool call at p50, but the per-call median flatters the case because tool-call latency has heavier tails than sampling latency. The cleaner cut is summed real time per turn, computed against the actual mart with sum(duration_ms) and the canonical outer-wrapper spans (run_sampling_request for model wait, handle_tool_call for tool execution).
That changes the picture by model:
| Model | Turns | Aggregate model-wait / tool-execution | Per-call mean ratio | Per-call p50 ratio |
|---|---|---|---|---|
| gpt-5.5 | 150 | 9.8x | 16x | 67x |
| gpt-5.4 | 93 | 1.5x | 3.3x | 90x |
In gpt-5.5 sessions, model wait dominates tool execution by roughly 10x in summed real time per turn. In gpt-5.4 sessions, the two are roughly comparable in summed time despite the per-call medians looking similar to gpt-5.5's. The driver: gpt-5.4 sessions execute much heavier tool calls on average (mean handle_tool_call ~10 s vs ~1.8 s for gpt-5.5). Whether that's tool-mix, tool-selection behavior, or harder tasks, this telemetry can't say without attribute-level inspection.
For the rest of this post, the prescription is calibrated to gpt-5.5, the dominant model in this corpus and Codex's current default for eligible ChatGPT plans.
Codex turn latency in gpt-5.5 sessions is not dominated by tool execution. It is dominated by model wait.
The runtime metaphor is correct. But the lever it implies is wrong if you read it as "tune your tools."
The high-leverage variable is not MCP tool health, shell shape, or command discipline. It is context discipline: smaller prompts, fewer tools-in-scope per turn, shorter tasks, less to sample over.
Fast Mode Reads Like a Platform-Side Response
This telemetry has no service_tier attribute, so I cannot tell which sessions in this corpus ran the Fast service tier vs Standard. So this section is inference about OpenAI's product behavior, not a claim about the data above.
On April 23, 2026, the same day gpt-5.5 launched, Codex CLI 0.124.0 made the Fast service tier the default for eligible ChatGPT plans (/fast off to opt out). Fast trades 2.5x credit consumption (2x on gpt-5.4) for 1.5x faster sampling. It is available on the Codex IDE extension, CLI, and app, but not via API key, where billing falls back to standard API pricing.
If sampling latency were a small share of agent turn time, "trade credits for 1.5x faster sampling" would be a bad product. OpenAI shipped it as the default. That is consistent with what the per-model gpt-5.5 numbers above show: model wait dominates the runtime. Fast mode reads like a platform-side response to the same finding the data surfaces.
What this changes for operators:
- Eligible ChatGPT plans: Standard tier is now an opt-out behavior, not the baseline. The ratios above don't tell you which tier any given session ran on.
- API-key operators: cannot use Fast credits at all. Sampling latency is whatever the API serves, and context discipline is the only lever.
- Either way: context discipline is the bigger lever. Fast mode pays in saved seconds. Context discipline pays in saved seconds and saved credits.
Why This Is Non-Obvious
The UI makes a coding agent feel like a conversation.
The telemetry makes it look like a runtime.
But raw telemetry has traps. A million spans sounds like a huge behavioral corpus until you inspect the span names. In this overlay, two low-level receive-loop spans made up nearly 95% of the span table.
That changes the claim:
Do not say: "I analyzed 1.18 million Codex spans, so I have a giant conversation corpus."
Say: "I analyzed a Codex telemetry overlay with 171 conversations, 279 user prompts, 2,998 tool results, and 61,873 operational spans after removing receive-loop noise."
That is smaller, but it is defensible.
The So What
If model wait dominates Codex turn latency, the operator levers reorder.
The first lever is not tool quality. It is what gets sampled:
- smaller working context per turn
- fewer tool definitions in scope at once
- shorter task descriptions and shorter prompts
- splitting hard tasks into multiple short turns instead of one big turn
- keeping conversation history concise
The second lever is observability. Track:
- p50 and p95 sampling latency by model
- p50 and p95 turn orchestration duration
- per-prompt tool-call count
- retries on sampling failures
- response-delta volume separately from operational event volume
- long-tail outliers
Tool tuning (MCP server health, shell discipline, command shape) still matters. But it is the second-order optimization. Context discipline is first.
This is also why "Codex feels slow today" is too vague. The operational question is where it is slow, and on this telemetry the default answer is "model wait."
One open cut I have not run yet: I have not separated successful long turns from stuck ones, so the 600 s p95 on session_task.turn may include sessions where the lever is "kill and restart" rather than "tighten context." That is the next query against the same mart.
The Operator Protocol
For long or failing Codex sessions, keep a runtime receipt:
If the turn is slow, identify whether the slow surface is model wait,
tool dispatch, command execution, or app-server queueing.
Optimize for that surface specifically.
Default assumption: model wait dominates. Tighten context first.
Examples (in order of typical effect size):
- Model wait is high (most likely): reduce prompt size, prune tools-in-scope, split the task into smaller turns, shorten conversation history.
- Tool dispatch is high: inspect MCP/app tool health and review where the agent's tool time actually goes.
- Command execution is high: run the command outside the agent once.
- App-server queueing is high: check local app/server health before blaming the model.
- External service latency is high: separate auth/network diagnosis from code edits.
The Field Manual Takeaway
Codex is a runtime for delegating coding actions. Runtimes need observability, and observability needs clean denominators.
The unsexy truth this telemetry forces: the runtime spends ~80x more time per call waiting for the model to think than executing the agent's tools. The lever isn't fancier tools. It is a tighter context.
Raw span count is not the story. Filter first, then make the claim, then optimize for what dominates the turn.
The public methodology repo is here: MPIsaac-Per/claude-code-ops-audit.